Does confidence separate right from wrong?
Accuracy-coverage curves and AUROC on an LLM's typed decisions
Posts 4 to 6 asked whether the model's confidence is honest. But a perfectly honest confidence can still be useless. As shown in post 4, ECE is 0 if every answer gets the overall accuracy as its confidence. However, that confidence can't tell a right answer from a wrong one. This causes trouble for a program if it acts on the answers with the highest confidence and hands the rest to a human agent. In order for the program to function properly, the right answers should tend to have higher confidence than the wrong ones.
So this post asks the question post 6 ended on: does higher confidence pick out the right answers? Post 6 touched on this by discussing accuracy at 80% coverage. There are two standard tools to measure this across all coverage levels: the accuracy-coverage curve and AUROC. Both are easy to compute from scratch. With AUROC, we'll see that on BANKING77 the best-calibrated confidence doesn't rank best.
Post 5 used CLINC150 only to fit temperatures. This post makes it a second running example. It has 150 intents in 10 domains, such as banking, travel and small talk. Its test set also has 1,000 requests that match none of those intents. Spotting them is a ranking problem. The "Out of scope" section deals with it.
Finally, pooling the two datasets shows how a single AUROC over mixed traffic can mislead.
Answering only when confident
The program sorts the answers from most to least confident and keeps a fraction from the top. The rest go to a human agent. The fraction of all answers it keeps is the coverage. The accuracy on those kept answers is the selective accuracy. coverage.py does this for the 3,080 BANKING77 test answers. It uses post 3's raw confidence:
  coverage  answers kept  confidence at least  accuracy
      100%          3080                0.101     86.9%
       95%          2926                0.369     90.2%
       90%          2772                0.497     92.3%
       85%          2618                0.598     93.7%
       80%          2464                0.706     94.9%
       70%          2156                0.827     96.7%
       60%          1848                0.887     97.5%
       50%          1540                0.924     98.0%
       40%          1232                0.950     98.6%
       30%           924                0.963     99.4%
       20%           616                0.972     99.5%
       10%           308                0.979     99.4%
Each coverage has a threshold in the third column. The program keeps only answers with at least that confidence. If the program keeps all answers, accuracy is 86.9%. Keeping the top 80% raises it to 94.9%. Keeping only the top half raises it to 98.0%.
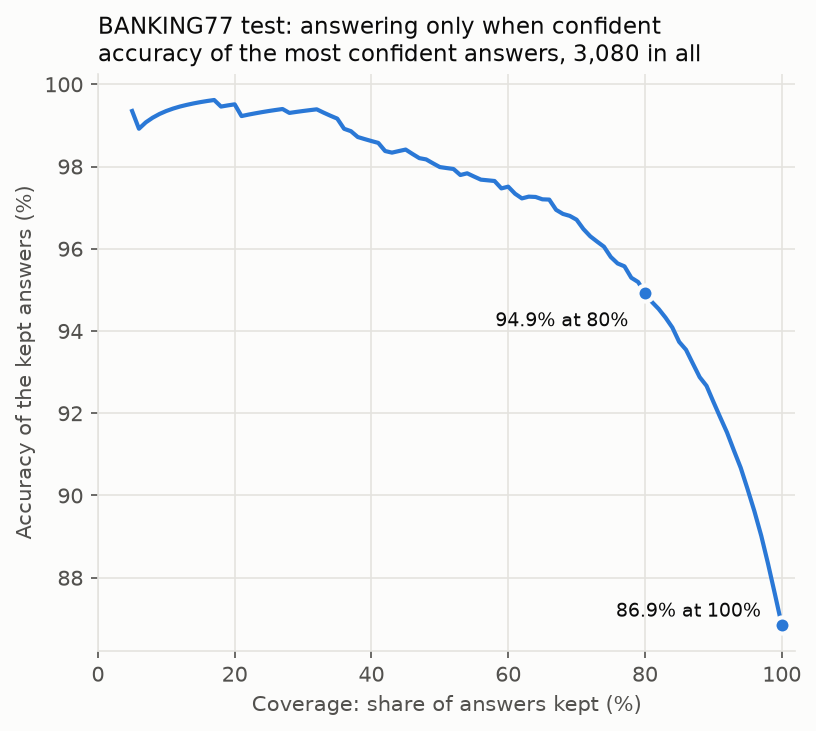
This accuracy-coverage curve is why each typed decision in this series comes with a confidence. To reach 95% or 99% accuracy on the requests it handles, the program doesn't need a model that is right on 95% or 99% of all messages. It only needs the confidence to rank right answers above wrong ones. Then it can keep a subset that meets its accuracy target and hand the uncertain tail to a human agent.
At low coverage the curve levels off and even dips. Accuracy is 99.5% at 20% coverage (3 wrong out of 616) but slips to 99.4% at 10% coverage (2 wrong out of 308). Those two wrong answers have very high confidence. Raising the threshold enough to drop them would keep only 4% of all answers. Post 8 looks at these confident mistakes.
Running coverage.py --dataset clinc150 prints the same table for CLINC150. Accuracy there starts higher at 94.8% with full coverage. It already passes 99% at 80% coverage (99.1%), while BANKING77 has to go below 40% coverage to get there.
Notice that this curve depends only on the order of the confidences and not on their exact values. Which answers make the top 80% depends on how the confidences rank them. So any change to the confidences that keeps their order leaves the curve exactly as it is. That will matter when we come back to the corrections of posts 5 and 6.
One number: AUROC
The curve shows the full trade-off, but comparing two sets of confidences is easier with a single number. The standard choice is AUROC (area under the ROC curve), which has a simple definition:
Pick one right answer and one wrong answer at random. How likely is it that the right one has the higher confidence?
An AUROC of 1.0 means every right answer has a higher confidence than every wrong one. An AUROC of 0.5 is a coin toss, where the confidence says nothing about which answer is right.
With 2,675 right and 405 wrong answers, the BANKING77 test set has 1,083,375 (right, wrong) pairs. That is few enough to check every pair one by one. auroc.py follows the definition directly, counting 1 when the right answer has the higher confidence and 0.5 for a tie. In the code, a right answer is a positive and its confidence is its score:
def auroc_by_pairs(scores, positive):
    """Count every (positive, negative) pair: 1 if the positive scores higher, 0.5 for a tie."""
    pos = [s for s, p in zip(scores, positive) if p]
    neg = [s for s, p in zip(scores, positive) if not p]
    wins = sum(1.0 if p > n else 0.5 if p == n else 0.0 for p in pos for n in neg)
    return wins / (len(pos) * len(neg))
We can also compute AUROC from the ROC (receiver operating characteristic) curve. As the threshold moves from 1 to 0, this curve plots the share of right answers above it against the share of wrong answers above it. The area under this curve equals the share of winning pairs computed by auroc_by_pairs. To verify this on BANKING77, auroc.py computes AUROC both ways and checks them against scikit-learn's roc_auc_score:
banking77 test: 2675 right and 405 wrong answers, 1,083,375 (right, wrong) pairs

1. Three ways to compute it, on the raw confidence:
   counting pairs:           0.8781
   area under the ROC curve: 0.8781
   sklearn roc_auc_score:    0.8781
So across all (right, wrong) pairs on BANKING77, the right answer has the higher confidence 88% of the time. On CLINC150 (--dataset clinc150), that share is 91%.
Calibration and ranking are different things
Like the accuracy-coverage curve, AUROC depends only on the order of the confidences and not on their exact values. What does that mean for the calibration methods from posts 5 and 6? auroc.py compares the raw confidence against three modified versions:
2. Changing the confidence:
   raw                                    AUROC 0.8781   (3079 distinct values)
   raw cubed (same order, other values)   AUROC 0.8781   (3079 distinct values)
   temperature-scaled                     AUROC 0.8874   (3079 distinct values)
   isotonic                               AUROC 0.8707   (66 distinct values)
- Cubing every confidence changes every value and ruins the calibration. But it keeps the order, so AUROC doesn't move.
- Temperature scaling can reorder answers slightly. Post 5 showed why: an answer's scaled confidence depends on its whole distribution, not only its top probability. On BANKING77 the new order is a little better (0.878 → 0.887). On CLINC150 it's a little worse (0.910 → 0.906).
- Isotonic regression never reverses the order of two answers, but its step function collapses 3,079 distinct values into 66. That turns many pairs into ties, and a tied (right, wrong) pair counts as only half a win. Since most of those pairs originally had the right answer ranked higher, AUROC drops from 0.878 to 0.871.
Put each version's ECE from posts 4 to 6 next to its AUROC:
| BANKING77 test | ECE (posts 4 to 6) | AUROC |
|---|---|---|
| raw | 0.041 | 0.878 |
| temperature-scaled | 0.030 | 0.887 |
| isotonic | 0.011 | 0.871 |
| constant (0.869, overall accuracy) | 0.000 | 0.500 |
Of the first three rows, isotonic regression is the best calibrated but ranks worst. Setting every confidence to the overall accuracy (0.869, from post 4) takes this to the extreme: perfect calibration and no ranking at all. Calibration asks whether answers with a confidence of 0.9 are right about 90% of the time. Ranking asks whether right answers get higher confidence than wrong ones. One doesn't follow from the other, so each needs its own measure. Post 8's threshold search uses only the ranking.
Out of scope
BANKING77 assumes that every message has a right answer among its intents. Real traffic doesn't work that way. For example, people might ask a bank's chatbot about the weather or ask it for a poem.
CLINC150 includes such requests: 1,000 of its 5,500 test messages match none of its 150 intents. As post 2 noted, a grammar forces the model to pick from the schema, so the schema needs an explicit escape hatch. The series gives these requests their own group OUT_OF_SCOPE with a single intent, which lets the model say "none of these". The CLINC150 numbers above already include these requests, with OUT_OF_SCOPE as their right answer.
Whatever group the model picks, its group step still gives each request a probability P(OUT_OF_SCOPE). We can use that probability as an out-of-scope score and ask the AUROC question again with out-of-scope requests as the positives. If we pick one out-of-scope request and one in-scope request at random, how likely is it that the out-of-scope one gets the higher P(OUT_OF_SCOPE)? out_of_scope.py computes the answer:
1. P(OUT_OF_SCOPE) as a score:
   median for out-of-scope requests: 0.908
   median for in-scope requests:     0.015
   AUROC: 0.992  (over 4,500,000 (out, in) pairs)
An AUROC of 0.992 is close to perfect: the two kinds of request barely overlap, and the ROC curve rises almost straight to the top-left corner:
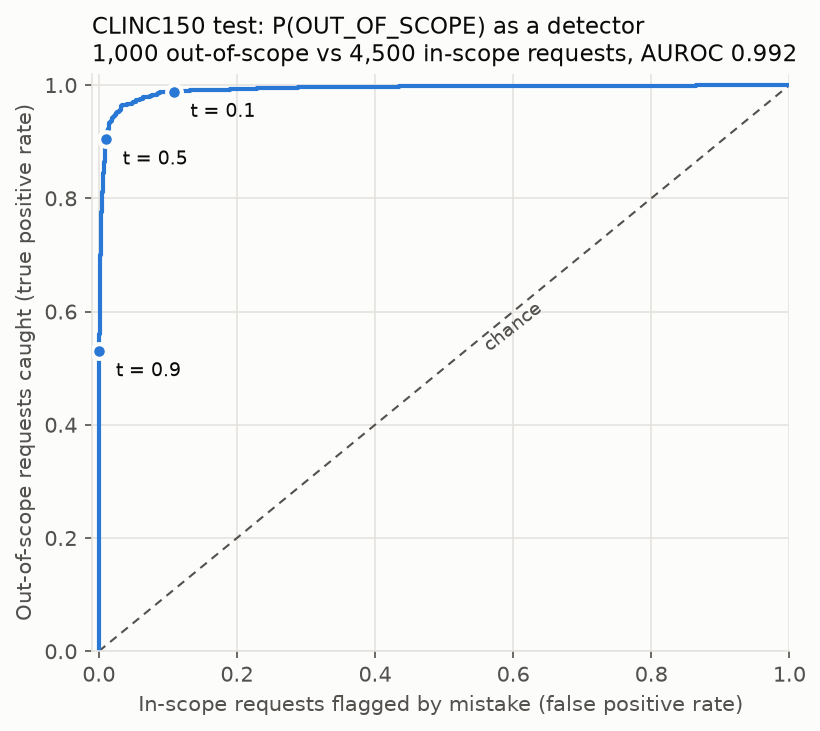
Still, AUROC doesn't say where to draw the line. Each threshold t along the curve trades out-of-scope requests caught against in-scope requests flagged by mistake:
2. Flag a request as out of scope when P(OUT_OF_SCOPE) is at least t:
       t  out-of-scope caught  in-scope flagged by mistake
     0.9                53.0%                        0.07%
     0.5                90.4%                        1.04%
     0.1                98.8%                       10.84%
    0.01                99.8%                       58.76%

3. The model's own answer (group OUT_OF_SCOPE, whatever its probability):
   out-of-scope caught: 92.6%, in-scope flagged by mistake: 1.64%
Every row comes from the same model with the same AUROC. Which row to pick depends on what each mistake costs: rejecting a request the program could have handled, or answering one it shouldn't. Instead of picking a threshold t, the simplest rule is to flag a request as out of scope whenever the model's own answer is OUT_OF_SCOPE. That catches 92.6% of out-of-scope requests and flags 1.64% of in-scope ones by mistake. Post 8 starts from that rule and also rejects low-confidence answers. It chooses the confidence threshold so at most 2% of in-scope calibration requests are rejected.
The pooling trap
There's one more thing about AUROC that often catches people off guard. Suppose your traffic mixes two kinds of request, such as text and voice messages. If you report one AUROC over all of it, is that a fair summary?
pooling.py pools the BANKING77 and CLINC150 test answers as if they were two kinds of traffic. The pooled AUROC still compares all (right, wrong) pairs. But each pair's right answer and wrong answer can now come from either dataset, which gives four kinds of pair. The pooled AUROC is the average of their AUROCs, weighted by how many pairs each kind has:
  right from banking77  vs  wrong from banking77   1,083,375 pairs   AUROC 0.878
  right from banking77  vs  wrong from clinc150      770,400 pairs   AUROC 0.901
  right from clinc150   vs  wrong from banking77   2,110,860 pairs   AUROC 0.882
  right from clinc150   vs  wrong from clinc150    1,501,056 pairs   AUROC 0.910

  weighted average: 0.892
  pooled AUROC:     0.892  (the same number)
The first and last rows are each dataset's own AUROC. The middle two are cross pairs: a right answer from one dataset against a wrong answer from the other. They measure nothing about either dataset alone. They only say how the two datasets' confidences sit relative to each other. Together they make up 53% of all pairs, so more than half of the pooled number measures only that.
With the raw confidence, the cross pairs score 0.901 and 0.882. Both are close to the datasets' own 0.878 and 0.910. Averaging only the first and last rows by their pair counts gives 0.896. Including the cross pairs gives 0.892, which is barely different. That's the harmless case.
Now switch to post 5's temperature-scaled confidence. Post 5 found that CLINC150 needed a much bigger correction. Its mean test confidence rose from 0.860 to 0.956, while BANKING77's rose only from 0.832 to 0.845. That moves the two datasets' confidences apart, which is exactly what the cross pairs measure. Run pooling.py --scaled:
  right from banking77  vs  wrong from banking77   1,083,375 pairs   AUROC 0.887
  right from banking77  vs  wrong from clinc150      770,400 pairs   AUROC 0.746
  right from clinc150   vs  wrong from banking77   2,110,860 pairs   AUROC 0.973
  right from clinc150   vs  wrong from clinc150    1,501,056 pairs   AUROC 0.906

  weighted average: 0.905
  pooled AUROC:     0.905  (the same number)
CLINC150's right answers are now so confident that they outrank BANKING77's wrong answers in 97.3% of pairs. With 2.1 million pairs, this is also the largest of the four rows. The other cross pairs drop to 0.746, but there are only 770,400 of them. So the pooled AUROC rises from 0.892 to 0.905.
Yet within each dataset, temperature scaling changes AUROC only a little: up 0.009 on BANKING77 and down 0.004 on CLINC150. Without the cross pairs, the weighted average would move only from 0.896 to 0.898. Almost all of the rise comes from the cross pairs. If you compared only the pooled AUROCs, you would think temperature scaling improved the ranking much more than it did.
That's the trap. When one kind of traffic is both more accurate and more confident than another, its right answers easily outrank the other's wrong ones. Those easy cross pairs pull the pooled AUROC up. With enough of them, it can even land above both datasets' own AUROCs.
The fix is simple: when the traffic is mixed, report each kind's AUROC next to the pooled one.
What's next
We now have a confidence that is reasonably honest (posts 4 to 6) and ranks answers well (AUROC 0.887 on BANKING77 after temperature scaling). On CLINC150 the model can also say "none of these". Post 8 turns this into decisions. It searches the calibration set for thresholds that meet a target stated in advance. Each message then takes one of three routes: act, ask the customer or hand over to a human agent. Requests flagged as out of scope get a fourth: reject.
Run it yourself
These scripts don't need the server. They read the calibration and test answers of both datasets saved by post 3's run.py. If you followed posts 3 and 5, they're already saved. Otherwise, run the run.py lines below first. They do need the server. coverage.py uses only Python's standard library. The other scripts need scikit-learn and Matplotlib. Install them with uv sync at the repo root, then run:
git checkout post-07
# Only if post 3's BANKING77 answers aren't saved yet (about 15 min):
python3 03-where-confidence-comes-from/run.py --split calib
python3 03-where-confidence-comes-from/run.py
# Only if post 5's CLINC150 answers aren't saved yet (about 25 min):
python3 03-where-confidence-comes-from/run.py --dataset clinc150 --split calib
python3 03-where-confidence-comes-from/run.py --dataset clinc150
# Post 7:
python3 07-accuracy-coverage-and-auroc/coverage.py
python3 07-accuracy-coverage-and-auroc/coverage.py --dataset clinc150
uv run 07-accuracy-coverage-and-auroc/auroc.py
uv run 07-accuracy-coverage-and-auroc/auroc.py --dataset clinc150
uv run 07-accuracy-coverage-and-auroc/out_of_scope.py
uv run 07-accuracy-coverage-and-auroc/pooling.py
uv run 07-accuracy-coverage-and-auroc/pooling.py --scaled
uv run 07-accuracy-coverage-and-auroc/plot.py
Your numbers should be close to these but not identical because they come from your own saved answers. After a rerun of post 3's run.py, most probabilities move by less than 0.01 and a few by up to 0.04. The number of distinct isotonic values can change with them.
BANKING77 is by PolyAI, licensed under CC BY 4.0: Casanueva et al., "Efficient Intent Detection with Dual Sentence Encoders", NLP4ConvAI workshop, 2020. CLINC150 is by Clinc, licensed under CC BY 3.0: Larson et al., "An Evaluation Dataset for Intent Classification and Out-of-Scope Prediction", EMNLP 2019.
Comments
Join the discussionNo comments yet. Be the first to comment.
Typed decisions from scratch
A deep dive into getting typed and trustworthy decisions from an LLM from scratch.<br/>This series covers grammars, logprobs, calibration, AUROC, and thresholding to produce outputs your code can safely rely on.<br/>Code: https://github.com/liminma/typed-decisions-from-scratch