Is the confidence honest?
Building reliability diagrams and computing ECE from scratch to check an LLM's confidence
Post 3 gave every answer a confidence, which was the model's own probability for the intent it picked. "I was charged twice for the same coffee" got transaction_charged_twice at 0.93. The request for a poem got card_about_to_expire at 0.
Post 3 also raised two questions about these confidences. The first was whether they rank answers well. Post 3 showed they do. A right answer usually gets a higher confidence than a wrong one. The second was whether a confidence means what it says. Are answers with a confidence of 0.8 right about 80% of the time? Post 3's table suggested the confidences are a little low. That matters whenever a program takes 0.9 to mean "right 9 times in 10".
A confidence is calibrated if it means what it says. This post measures how far from calibrated the model's confidence is.
The weather forecaster's test
Calibration is easiest to picture with a weather forecast. For example, take every day a forecaster predicted a 70% chance of rain. If it rained on about 70% of them, the forecaster is calibrated at 70%. If it rained on 90% of them, the forecaster is too cautious. If it rained on 40%, the forecaster is too bold. Do the same for the 10% days, the 50% days and so on, and you know how far to trust the forecasts.
The same test works for the model, but with one change. A forecaster uses a few round numbers, so many days share the same forecast. The model's confidences come out like 0.9314, and hardly any two are exactly the same. So instead, we divide the scale from 0 to 1 into ranges and group the answers by range. Then we compare each group's mean confidence with the share of its answers that were right.
Grouping the answers
Post 3 saved all 3,080 BANKING77 test answers with their confidences. ece.py reads and sorts them into 15 equal-width bins: confidences from 0 to 0.067, 0.067 to 0.133, and so on up to 1. For each bin it prints how many answers fell in, their mean confidence and the share that were right:
banking77 test: 3080 answers, accuracy 86.9%, mean confidence 83.2%

          bin  answers  confidence  accuracy     gap  adds to ECE
0.067-0.133        5       0.112     0.000  -0.112       0.0002
0.133-0.200       16       0.169     0.188  +0.019       0.0001
0.200-0.267       27       0.239     0.148  -0.091       0.0008
0.267-0.333       65       0.305     0.246  -0.059       0.0012
0.333-0.400       77       0.367     0.377  +0.010       0.0002
0.400-0.467       84       0.433     0.548  +0.114       0.0031
0.467-0.533       86       0.501     0.605  +0.104       0.0029
0.533-0.600      107       0.565     0.692  +0.126       0.0044
0.600-0.667       89       0.634     0.719  +0.086       0.0025
0.667-0.733      123       0.704     0.805  +0.101       0.0040
0.733-0.800      164       0.768     0.817  +0.049       0.0026
0.800-0.867      249       0.837     0.884  +0.046       0.0037
0.867-0.933      537       0.903     0.948  +0.044       0.0078
0.933-1.000     1451       0.967     0.982  +0.016       0.0073

ECE, 15 bins: 0.0409
The gap is a bin's accuracy minus its mean confidence. A positive gap means the answers in that bin are right more often than their confidence says.
Only 14 bins are listed in the script's output. The first bin (from 0 to 0.067) is empty because no test answer had a confidence below 0.067. The script skips empty bins. The poem request from post 3, whose confidence is 0, isn't one of the test messages.
The first line of the output already hints at the result. Across all answers, the mean confidence is 83.2%, but the accuracy is 86.9%. The model is right more often than its confidence says.
The bins show which confidences are too low. Every bin from 0.4 up has a positive gap. For example, answers with a confidence around 0.50 are right 60.5% of the time, and answers around 0.70 are right 80.5% of the time. So the model is under-confident, as post 3's table suggested.
The gaps go both ways when confidences are below 0.4. But those five bins are small. They hold only 190 answers in total, and a bin of 16 answers can easily have a gap of 0.1 by chance. The bins from 0.4 up are bigger, and their gaps are all positive. That's what makes the pattern believable.
Under-confidence may be a surprise. Much of what's written about LLM confidence warns of over-confidence. But it's the other way round here. Which way the confidence errs depends on the model, the prompt and the task. It has to be measured each time rather than assumed.
The reliability diagram
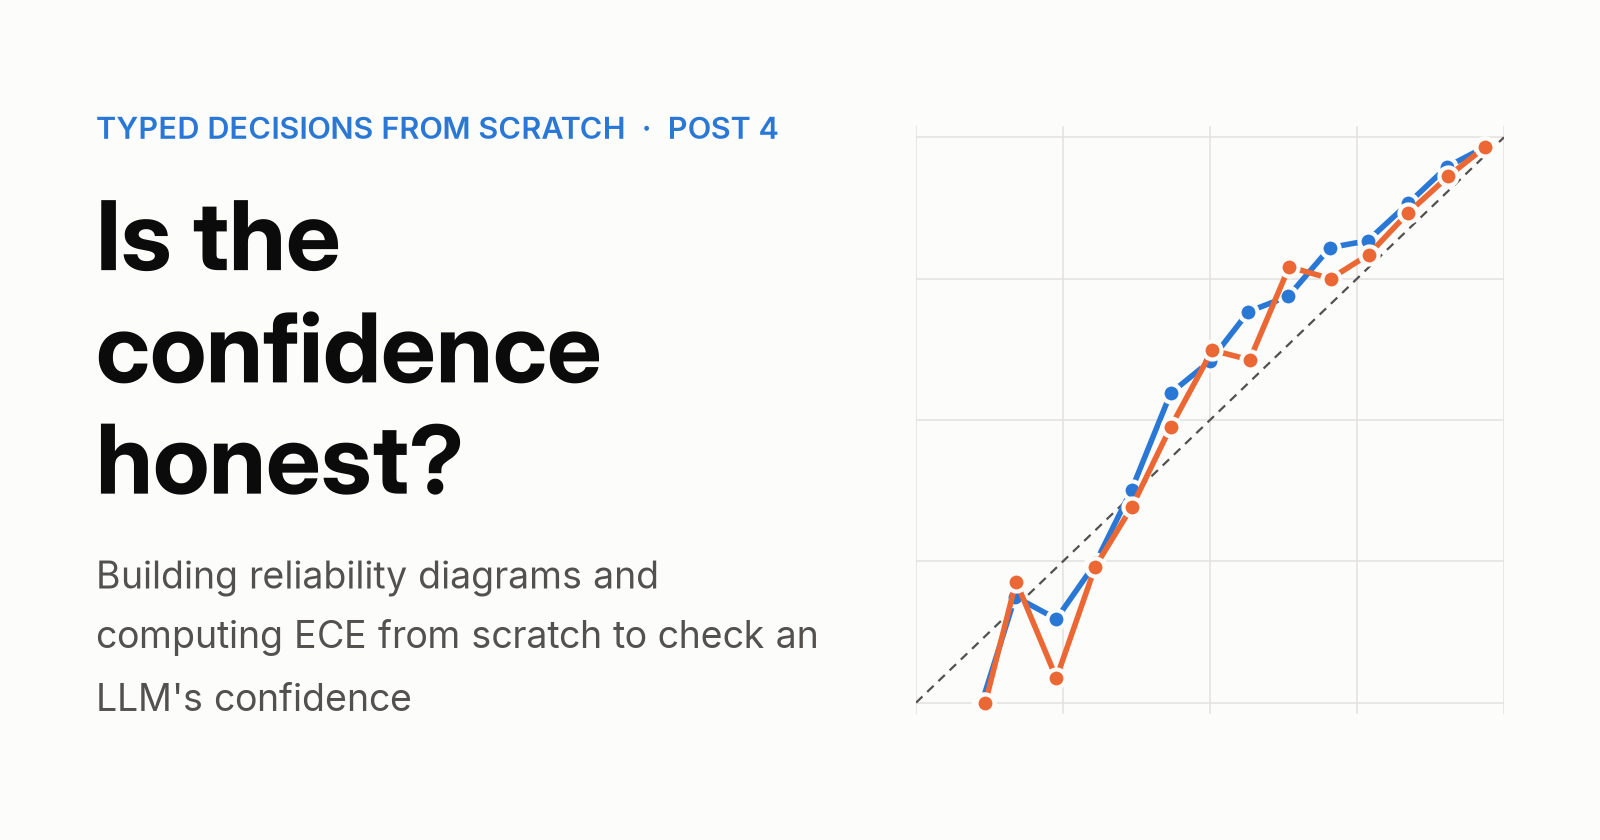
The table from ece.py can be plotted as a reliability diagram. plot.py draws one with Matplotlib:
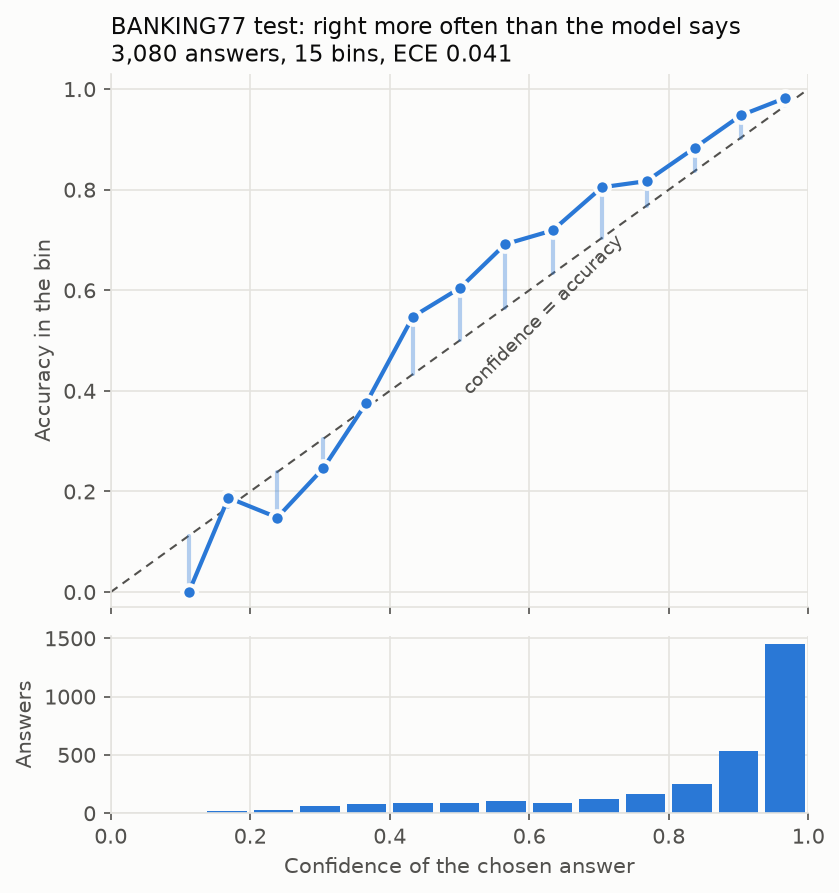
Each point is a bin. It sits at the bin's mean confidence on the horizontal axis and its accuracy on the vertical axis. Confidence equals accuracy on the dashed diagonal. That's where a calibrated model's points sit. A point above the diagonal shows under-confidence, and a point below shows over-confidence. The light vertical lines are the gaps.
The histogram underneath shows how many answers fall in each bin. That tells you how much each point matters. Nearly half the answers (1,451 of 3,080) are in the top bin, whose point is close to the diagonal. The large gaps are in the middle, where there are fewer answers. So for most answers, the confidence is closer to the accuracy than the middle of the diagram suggests.
One number: ECE
A diagram is good for looking at, but you can't check it in code or compare twenty of them at a glance. For that we need one number. The expected calibration error (ECE) weights the absolute value of each bin's gap by the bin's share of the answers and adds up the results:
$$\text{ECE} = \sum_{\text{bins}} \lvert \text{gap} \rvert \times \frac{\text{answers in the bin}}{\text{all answers}}$$
The last column of the table, "adds to ECE", is each bin's contribution. The bin from 0.533 to 0.600 has a gap of 0.126 and holds 107 of the 3,080 answers, so it adds 0.126 × 10⁷ / 3,080 = 0.0044. All 14 non-empty bins add up to 0.041. That's the mean absolute gap over all 3,080 answers.
ece.py computes ECE with two short functions. reliability_bins sorts the answers into bins, and ece adds up the bins' contributions:
def reliability_bins(conf, correct, n_bins=15):
    """One entry per non-empty bin: its range, size, mean confidence and accuracy."""
    edges = [b * (1 / n_bins) for b in range(n_bins)] + [1.0]
    members = [[] for _ in range(n_bins)]
    for c, ok in zip(conf, correct):
        members[min(bisect.bisect_right(edges[1:-1], c), n_bins - 1)].append((c, ok))
    return [{"lo": edges[b], "hi": edges[b + 1], "n": len(m),
             "conf": sum(c for c, _ in m) / len(m), "acc": sum(ok for _, ok in m) / len(m)}
            for b, m in enumerate(members) if m]


def ece(conf, correct, n_bins=15):
    total = len(conf)
    return sum(abs(b["conf"] - b["acc"]) * b["n"] / total for b in reliability_bins(conf, correct, n_bins))
reliability_bins finds the bin for each confidence with bisect_right from Python's standard bisect module. A confidence that falls exactly on an edge goes in the bin above it. The one exception is 1.0, which goes in the last bin. The rest is averages and a weighted sum.
Is 0.041 good or bad? It depends on what the confidence is used for. A program that only ranks answers by confidence doesn't need it to be calibrated. But some programs take the number at face value. They show it to customers or weigh it against the cost of a mistake. Being off by 0.04 on average matters to them. Post 5 brings ECE down to 0.030 and post 6 to 0.011.
What ECE hides
ECE is the calibration number most papers report, so it's worth knowing its blind spots.
It hides direction. ECE takes absolute values, so it can't tell under-confidence from over-confidence. A model that's too modest everywhere can score the same as one that's too bold everywhere. So can a model that's too modest in some bins and too bold in others. The diagram shows which way the model is off, and the fix depends on that.
It depends on the bins. ece.py ends by recomputing ECE on the same answers with other bin counts:
The same answers with other bin counts:
   5 bins: ECE 0.0402
  10 bins: ECE 0.0404
  15 bins: ECE 0.0409
  20 bins: ECE 0.0410
  30 bins: ECE 0.0411
On the 3,080 test answers, ECE barely moves. On the 770 calibration answers, it rises from 0.045 with 5 bins to 0.060 with 30. More bins mean fewer answers per bin, and the calibration set has few to start with. So a bin's gap is more likely to be large by chance. And since ECE takes absolute values, these random gaps add up instead of cancelling out. ECE values are comparable only if they use the same bins. This series always uses 15 equal-width bins.
It can be fooled. The last line of the ece.py output:
Every answer given the same confidence, 0.869 (the accuracy): ECE 0.0000
It ignores the model's confidences and gives every answer a made-up confidence of 0.869. Since every answer has the same confidence, they all land in one bin. And since 0.869 is the overall accuracy, that bin's confidence and accuracy match exactly. ECE is 0. Yet this confidence is useless. It's the same for right and wrong answers, so it can't tell us which answers to trust.
But the model's own confidences can because they differ from answer to answer. Answers in the top bin are right 98.2% of the time. Answers around 0.30 are right only 24.6% of the time. Calibration means the confidence is honest on average. Whether it separates right answers from wrong ones is a different question, and post 7 takes it up.
Two sets of answers
Posts 5 and 6 fix the confidence by fitting a correction to labelled answers. The usual machine-learning rule applies: fit on one set and measure on a held-out one. The model itself is never trained. Only the correction on top of it is fitted.
The series keeps two sets:
- the calibration set: 770 BANKING77 messages from the dataset's training data (10 per intent). The series fits its corrections and post 8's thresholds on this set.
- the test set: BANKING77's official 3,080 test messages. This is the held-out set. The series reports results on this set and never fits or chooses anything on it.
The calibration set shows the same pattern as the test set. Its accuracy is 86.9% against a mean confidence of 82.4%, and most of its bins have positive gaps. Its ECE is higher at 0.055, partly because 770 answers spread over 15 bins leave some bins with fewer than ten answers.
What's next
So is the confidence honest? Not quite. It ranks answers well, but it's too modest by about 0.1 in the middle. Post 5 fixes that with temperature scaling: one number per step fitted on the calibration set. Each number makes the probabilities sharper or flatter without changing which answer the model picked.
Run it yourself
This post's scripts don't need the server. They read the answers that post 3's run.py saved. If those answers aren't saved yet, first run the two run.py lines below. They do need the server.
git checkout post-04
# Only if post 3's answers aren't saved yet (about 15 min):
python3 03-where-confidence-comes-from/run.py --split calib
python3 03-where-confidence-comes-from/run.py
# Post 4:
python3 04-is-the-confidence-honest/ece.py
python3 04-is-the-confidence-honest/ece.py --split calib
uv run 04-is-the-confidence-honest/plot.py               # needs matplotlib: uv sync at the repo root
ece.py uses only Python's standard library. Your numbers should be close to these. After a rerun of post 3, most probabilities move by less than 0.01. A few move by as much as 0.04.
BANKING77 is by PolyAI, licensed under CC BY 4.0: Casanueva et al., "Efficient Intent Detection with Dual Sentence Encoders", NLP4ConvAI workshop, 2020.
Comments
Join the discussionNo comments yet. Be the first to comment.
Typed decisions from scratch
A deep dive into getting typed and trustworthy decisions from an LLM from scratch.<br/>This series covers grammars, logprobs, calibration, AUROC, and thresholding to produce outputs your code can safely rely on.<br/>Code: https://github.com/liminma/typed-decisions-from-scratch